ECONOMIC OVERVIEW
Colorado’s economy continues to grow with the addition of 44,800 new non-agricultural jobs over the past 12 months. This represents a reasonable growth rate of 1.7%. As stated in last quarter’s Gardner Report, we continue to see a modest slowdown in employment gains, but that’s to be expected at this stage of the business cycle. I predict that employment growth in Colorado will pick back up as we move through the year, adding a total of 70,000 new jobs in 2019, which represents a growth rate of 2.6%.
In February, the state unemployment rate was 3.7%, up from 2.9% a year ago. The increase is essentially due to labor force growth, which rose by more than 84,000 people over the past year. On a seasonally adjusted basis, unemployment rates in all the markets contained in this report haven’t moved much in the past year, but Boulder saw a modest drop (2.7%), and the balance of the state either remained at the same level as a year ago or rose very modestly.
HOME SALES
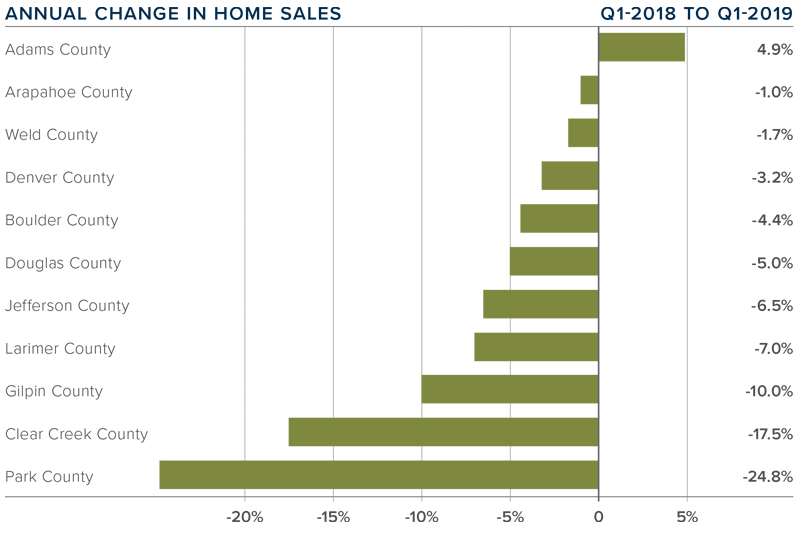
- In the first quarter of 2019, 11,164 homes sold — a drop of 3% compared to the first quarter of 2018 and down 13.5% from the fourth quarter of last year. Pending sales in the quarter were a mixed bag. Five counties saw an increase, but five showed signs of slowing.
- The only market that had sales growth was Adams, which rose 4.9%. The rest of the counties contained in this report saw sales decline, with a significant drop in the small Park County area.
- I believe the drop in the number of home sales is partially due to the significant increase in listings (+45.6%), which has given would-be home buyers more choice and less need to act quickly.
- As mentioned above, inventory growth in the quarter was significant, but I continue to believe that the market will see sales rise. I expect the second half of the year to perform better than the first.
HOME PRICES
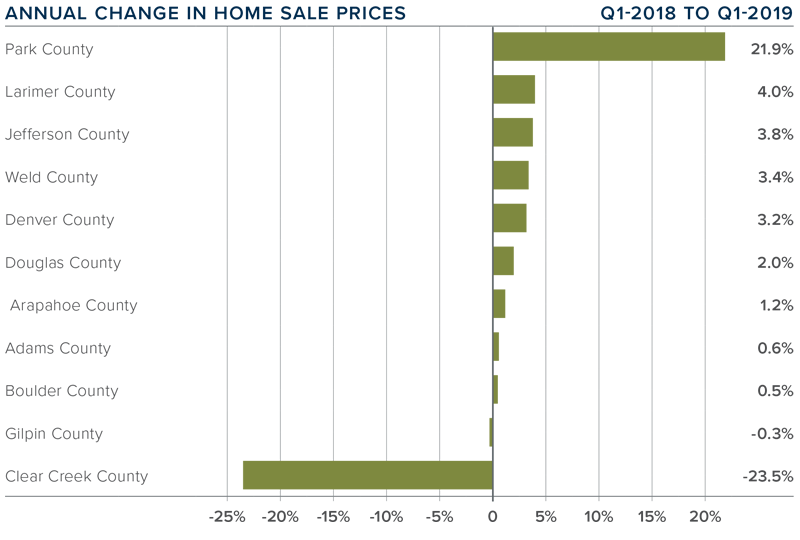
- Home prices continue to trend higher, but the rate of growth is tapering. The average home price in the region rose just 2.1% year-over-year to $456,243. Home prices were .3% higher than in the fourth quarter of 2018.
- I anticipate that the drop in interest rates early in the year will likely get more buyers off the fence and this will allow prices to rise.
- Appreciation was again strongest in Park County, where prices rose 21.9%. We still attribute this rapid increase to it being a small market. Only Clear Creek County experienced a drop in average home price. Similar to Park County, this is due to it being a very small market, making it more prone to significant swings.
- Affordability remains an issue in many Colorado markets but that may be offset by the drop in interest rates.
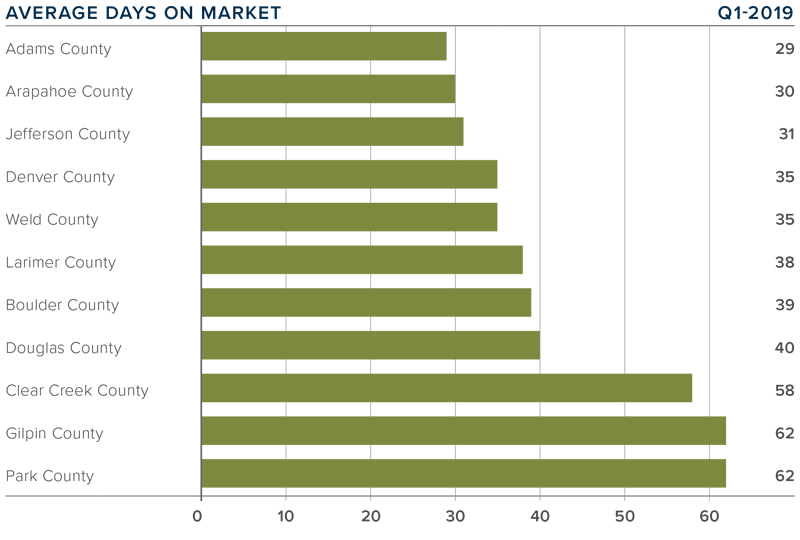
DAYS ON THE MARKET
- The average number of days it took to sell a home in Colorado rose five days compared to the first quarter of 2018.
- The amount of time it took to sell a home dropped in two counties — Gilpin and Park — compared to the first quarter of 2018. The rest of the counties in this report saw days-on-market rise modestly with the exception of the small Clear Creek market, which rose by 26 days.
- In the first quarter of 2019, it took an average of 42 days to sell a home in the region, an increase of four days compared to the final quarter of 2018.
- Job growth drives housing demand, but buyers are faced with more choice and are far less frantic than they were over the past few years. That said, I anticipate the late spring will bring more activity and sales.
CONCLUSIONS

This speedometer reflects the state of the region’s real estate market using housing inventory, price gains, home sales, interest rates, and larger economic factors.
For the first quarter of 2019, I have moved the needle a little more in favor of buyers. I am watching listing activity closely to see if we get any major bumps above the traditional increase because that may further slow home price growth; however, the trend for 2019 will continue towards a more balanced market.